Projects
Horseshoe process regression
Full Description
In healthy, premenopausal women, basal body temperature (BBT) follows a well-defined pattern. Each menstrual cycle starts with the onset of the period, at which time BBT is low. With ovulation (usually around day 14 of the menstrual cycle), a woman's BBT jumps and remains high until the onset of the next period, when it drops suddenly to the pre-ovulation temperature and the cycle repeats. For an individual woman, tracking BBT over several menstrual cycles may give insight into underlying health conditions or provide guidance on how best to time sexual intercourse to improve or reduce chances of pregnancy, especially when used in combination with other health and fertility indicators. BBT is difficult to model. Although the pattern outlined above generally holds, the details may vary across and within women, with the date of ovulation sometimes very early or late, the full menstrual cycle length ranging from 20 to 40+ days, and differing degrees of sharpness in the temperature jump. Many conventional methods to analyze these data would oversmooth the temperature jump and introduce excess motion into the flat pre- and post-ovulation portions of the association, making it difficult to identify the true time of ovulation. This bias could have real ramifications for a couple trying to achieve or avoid pregnancy. The data below illustrate some of these features, showing observed BBT data from one woman's menstrual cycle and the results from three different fitted models. The observed data are given as dots, with an expert's best guess of the true ovulation date given as a vertical dashed line. Three different model fits and their 95% uncertainty intervals are shown. We see that using either a Gaussian process regression (GPR) or a penalized spline model (Pspline) would estimate the date of ovulation as three days earlier than reality. Horseshoe process regression (HPR; the method I propose) accurately identifies the date of ovulation. 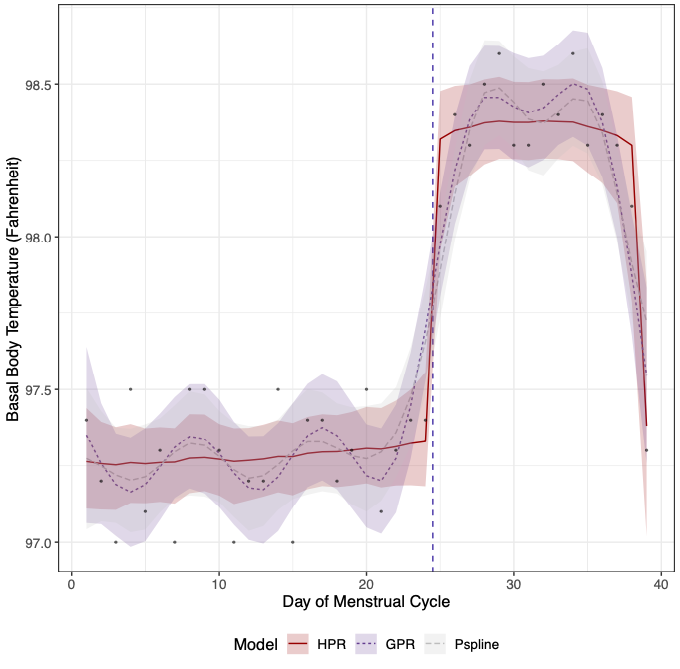
How does HPR address this problem? The horseshoe distribution is a Bayesian shrinkage prior. Suppose we are fitting a linear regression model with $p$ predictors. If $p$ is large, we may want to shrink the estimates of the linear coefficients $\beta_j$, $j = 1, ..., p$. The horseshoe prior is one way to do so, in which we assume each $\beta_j$ is normally distributed with mean $0$ and variance $\tau^2 \lambda_j^2$, with $\tau, \lambda_j$ independently distributed as half-Cauchy with location $0$ and scale $1$. We call $\tau$ the global shrinkage parameter, as it provides overall shrinkage on the linear coefficients. If $\tau$ is large, the prior admits many large coefficients; if $\tau$ is small, the coefficients are pushed towards zero. However, the horseshoe prior also includes local shrinkage parameters, $\lambda_j$, one for each linear coefficient. The local shrinkage parameters allow individual coefficients to attain high values, even if $\tau$ is small. To fit a BBT trajectory, we extend the horseshoe distribution as a stochastic process, assuming that incremental change in BBT over time is horseshoe distributed. Let $B_i$ be a measurement of BBT taken on day $t_i$, $i = 1,...,n.$ Then we assume that $Bi−Bi−1 ∼N(0,τ2λ2i(ti−ti−1))$, where $\tau, \lambda_i$ have the same priors as given above. This implies that on average we expect to see very little change in BBT over time, with the exception of a select number of large, sudden jumps, created by the local shrinkage parameters $\lambda_i$. That is the model fit we see from the HPR in the figure above--something that looks like a step function, although HPR is adept at fitting any association that exhibits abrupt changes. After exploring this simplest formulation of HPR, I subsequently extended it to allow for additional linear predictors, non-Gaussian outcomes, monotonicity constraints, and correlated data, and am currently working on a variational inference implementation (in addition to my original HMC implementation). All of these methods are implemented in the R package [HPR](https://github.com/elizabethchase/HPR) that I developed. Products
- [Slides](https://elizabethchase.github.io/files/enar_hpr_2022.pdf) from my talk given at ENAR (March 2022). - Manuscript (submitted): **Chase EC**; Taylor JMG; Boonstra PS. "Modeling data using horseshoe process regression." - Manuscript (in preparation): **Chase EC**; Taylor JMG; Boonstra PS. "A variational inference approach for horseshoe process regression with correlated data." - R package: [HPR](https://github.com/elizabethchase/HPR) Competing risks tradeoffs in prostate cancer care
Full Description
In localized prostate cancer patients, other-cause mortality (OCM) is the primary cause of death. Nonetheless, most research focuses on prostate-cancer specific mortality (PCSM), with less attention paid to OCM. My collaborators in radiation oncology wanted to better understand how risk of OCM affects risk of PCSM and how treatment decision-making can minimize patients' risk of overall mortality, rather than just PCSM. To address these questions, I developed a prediction model for OCM in prostate cancer patients using data from the National Health and Nutrition Examination Survey (NHANES) and then used properties of the cumulative incidence function to integrate cause-specific models of the hazards of OCM and PCSM, which provided estimates of the absolute risk of PCSM, OCM, and overall mortality under different treatment regimens. Products
- [Paper](https://elizabethchase.github.io/files/chase_occam.pdf): **Chase EC**; Bryant AK; Sun Y; Jackson WC; Spratt DE; Dess RT; Schipper MJ. “Development and Validation of a Life Expectancy Calculator for U.S. Prostate Cancer Patients.” BJU International (April 2022). - Manuscript (in preparation): Covert EC; **Chase EC**; Dess RT; Schipper MJ; Jackson WC. “Data integration for prostate cancer specific mortality prediction.” - Shiny apps: [OCCAM](occam-cap.org), [STAR-CAP](star-cap.org) Full Description
Put description here! Products
- [Paper](https://elizabethchase.github.io/files/Ezell2022_CRT.pdf): Ezell JM and **EC Chase**. “Forming a critical race theory of environmental disaster: management and social meanings in the Flint Water Crisis.” Journal of Environmental Management (2022). - [Paper](https://elizabethchase.github.io/files/Ezell2022_child.pdf): Ezell JM; Bhardwaj S; **Chase EC**. “Child lead screening behaviors and health outcomes following the Flint Water Crisis: a cross-sectional analysis.” Journal of Racial and Ethnic Health Disparities (Jan. 2022). - [Paper](https://elizabethchase.github.io/files/ezell2021_adult.pdf): Ezell JM and **EC Chase**. “A population-based assessment of physical symptoms and mental health outcomes among adults following the Flint Water Crisis.” Journal of Urban Health (Apr. 2021). - Manuscript (under review): Ezell JM and **EC Chase**. “How Does Race Impact Resource Uptake Following Environmental Disaster? Examining Responses to Government Intervention During the Flint Water Crisis.” - Manuscript (submitted): Shelton J; **Chase EC**; Lee A; Ezell JM. “Gender, health, and social networks during public health disasters: an evaluation of the Flint Water Crisis.” Gun violence
Full Description
Put description here! Products
- [Poster](https://elizabethchase.github.io/files/dv_shootings_poster.pdf) made in collaboration with Dr. Veronica Berrocal, presented at Data Science for Public Good Symposium (Feb. 2020). - [Slides](https://elizabethchase.github.io/files/gunviolece_integration.pdf) presented at my lab meeting in Feb. 2021, based on work I carried out for my final project for BIOSTAT 880: Missing Data.